R plot symbols

Plot symbols are set within the plot() function by setting the pch parameter (plot character?) equal to an integer between 1 and 25. Since it's hard to remember what symbol each integer represents, the picture below may serve as a reminder.

Simple Plot Examples in R

Below are some simple examples of how to plot a line in R, how to fit a line to some points, and how to add more points to a graph. In the first example we simply hand the plot function two vectors. If we handed the plot function only one vector, the x-axis would consist of sequential integers. In the second example we set many different parameters in the plot function, including labeling the axes, setting the range of each axis, setting the plot symbol, and the color to be used, and giving the plot a title.
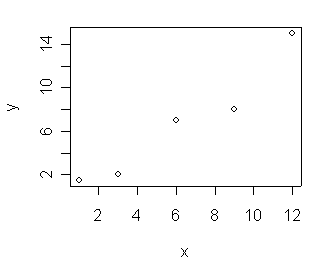
# Example 1
# make a very simple plot
x <- c(1,3,6,9,12)
y <- c(1.5,2,7,8,15)
plot(x,y)
# Example 2. Draw a plot, set a bunch of parameters.
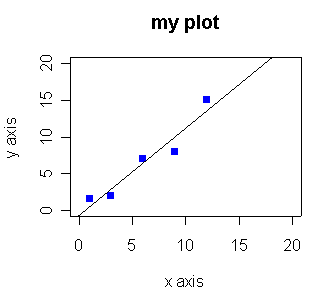
plot(x,y, xlab="x axis", ylab="y axis", main="my plot", ylim=c(0,20), xlim=c(0,20), pch=15, col="blue")

# fit a line to the points
myline.fit <- lm(y ~ x)

# get information about the fit
summary(myline.fit)

# draw the fit line on the plot
abline(myline.fit)

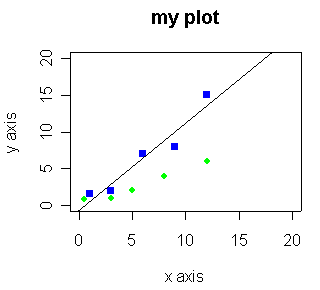
# Example 3
# add some more points to the graph
x2 <- c(0.5, 3, 5, 8, 12)
y2 <- c(0.8, 1, 2, 4, 6)

points(x2, y2, pch=16, col="green")

R is available from CRAN at http://cran.r-project.org/
Chris Seidel